The line graph shows the past and projected finances for a local authority in New Zealand. Summarize the information by selecting and reporting the main features and make comparisons where relevant.

The line graph shows the past and projected finances for a local authority in New Zealand.

Summarize the information by selecting and reporting the main features and make comparisons where relevant.
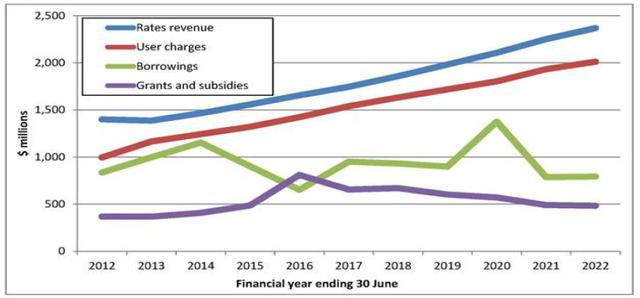
The line graph displays the previous budget planned for regional government and
milions
Correct your spelling
millions
of money spent in 10 years. The most noticeable trend is that Rates Revenew
reain
Correct your spelling
remain
retain
the highest value and showed upward
troughout
Correct your spelling
throughout
ten years
while
Grants and subsidies contrasted with the flat line in the graph.
Moreover
, User charges have
been risen
Change to the active voice
risen
show examples
constantly over one decade.
Submitted by suellend.cunha on

Unauthorized use and/or duplication of this material without express and written permission from this site’s author and/or owner is strictly prohibited. Excerpts and links may be used, provided that full and clear credit is given to Writing9 with appropriate and specific direction to the original content.

Basic structure: Write more paragraphs.
Basic structure: Add more body paragraphs.
Common mistake: Your writing should be 150-250 words.
Basic structure: Write more paragraphs.
Vocabulary: Only 4 basic words for charts were used.
Vocabulary: The word "graph" was used 2 times.
What to do next:
Look at other essays: