The chart below gives information about how families in one country spent their weekly income in 1968 and in 2018. Summarise the information by selecting and reporting the main features, and make comparisons where relevant.

The chart below gives information about how families in one country spent their weekly income in 1968 and in 2018.

Summarise the information by selecting and reporting the main features, and make comparisons where relevant.
The chart illustrates the compassion of families’ spending
in
particular
Correct article usage
a particular
show examples
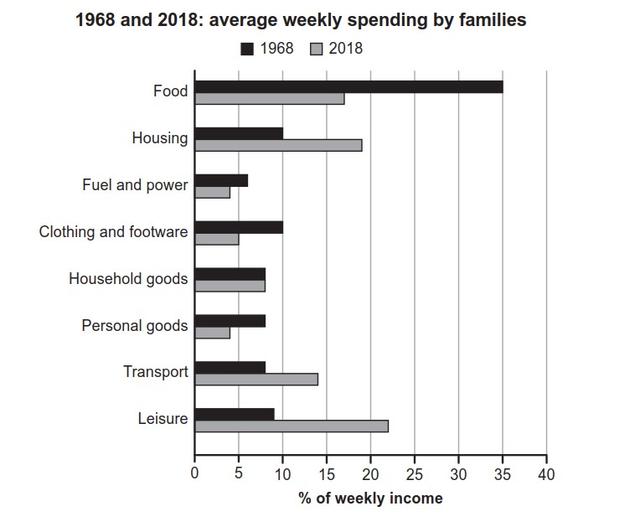
state per week in the years 1968 and 2018.
Overall
, in 1968 food comprised the biggest part of average weekly spending by families.
On the contrary
, in 2018 the highest percentage of
income
was spent on leisure.
According to
the graph, in 1968 food, housing and clothing and
foodware
Correct your spelling
footwear
food ware
were among the highest expenditures of families with 35% and 10%of weekly
income
respectively. In the same year, the least amount of money was spent on fuel and power - approximately 6 per cent of
income
. It can be
also
noted that household goods, personal items and transport shared almost the same figure of expenditures and was 8 per cent.  In comparison, in 2018 the highest amount of money was spent on leisure - marginally above 20 per cent of weekly
income
. The average spending on food decreased
at
Change preposition
to
show examples
approximately 18% compared with 1963. Total spending on clothing and software and personal goods showed a decline
while
transport and housing expenditures increased through a given period. What is more,
the
Correct article usage
apply
show examples
family spending on household goods remained constant in both 1968 and 2018.
Submitted by katya.8932.45 on

Unauthorized use and/or duplication of this material without express and written permission from this site’s author and/or owner is strictly prohibited. Excerpts and links may be used, provided that full and clear credit is given to Writing9 with appropriate and specific direction to the original content.

Basic structure: Use less body paragraphs.
Vocabulary: Replace the words income with synonyms.
Vocabulary: The word "amount" was used 2 times.
Vocabulary: The word "approximately" was used 2 times.
Vocabulary: Use several vocabularies to present the data in the second paragraph.
Topic Vocabulary:
  • compare
  • spending patterns
  • allocated
  • weekly income
  • significant changes
  • essential items
  • food
  • housing
  • clothing
  • leisure
  • communication
  • increase
  • decrease
  • twofold rise
  • substantial increase
  • quadrupling
  • declined
  • food and drink
  • slight increase
  • prioritizing
  • necessities
  • transitioned
  • portio
  • non-essential items
What to do next:
Look at other essays: