
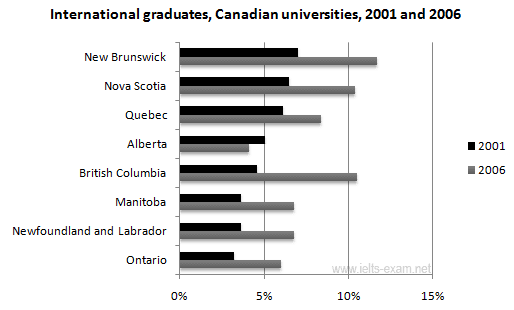
The chart shows the percentage change in the proportion of international students among university graduates in Canada between 2001 and 2006. In the diorama, it can be seen eight different universities,which are called New Brunswick, Nova Scotia, Quebec, Alberta, British Colombia, Manitoba, Newfoundland and Labrador,
Ontario
.
Correct word choice
and Ontario
Overall
,the number of graduations by international students increased significantly at all universities from 2001 to 2006.
In the five years period, from 2001 to 2006 New Brunswick rose by almost five Linking Words
percent
from 7% to Change the spelling
per cent
approximattely
12%. in the same way, Nova Scotia grew up from about 6% to just Correct your spelling
approximately
over10
%. The highest growth was in Britain Columbia, where graduates had doubled, from slightly less than 5% to about 11%.
Other Canadian universities made modest rises of about 2 to 3 Correct your spelling
over 10
percent
. The lowest percentage increase was in Alberta Change the spelling
per cent
university
, from almost 5% to 7%.
In conclusion, it can be added that Capitalize word
University
distribution
of international graduates across the provinces of Canada had varied particularly over Correct article usage
the distribution
this
Linking Words
five year
period.Add a hyphen
five-year