
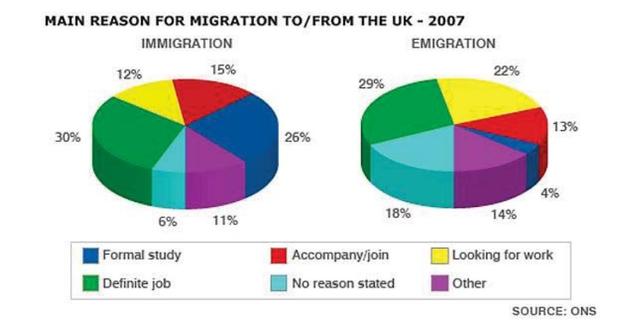
This
pie chart depicts the percentage of reasons for Linking Words
immigration
and Use synonyms
emigration
to and from the UK in 2007.It is clear from the graph that the most Use synonyms
reason
for both Use synonyms
immigration
and Use synonyms
emigration
is for Use synonyms
the
definite Correct article usage
a
job
.
Use synonyms
According to
what is shown, the most Linking Words
reason
behind Use synonyms
immigration
is for a definite Use synonyms
job
which is 30 followed by formal study 26 ,the third Use synonyms
reason
Use synonyms
is accompany
the figure is half definite Change the verb form
accompanies
job
is 15 after that comes looking for a Use synonyms
job
,other Use synonyms
reason
and no Use synonyms
reason
stated.
For Use synonyms
emigration
,which shows the same behaviour as Use synonyms
immigration
,the most Use synonyms
reason
people emigrates is a definite Use synonyms
job
29, followed by no Use synonyms
reason
stated 18 and the proportion of other Use synonyms
reason
is 14 ,the least proportion is for formal study which is 4.
Use synonyms
To sum up
,the percentage of reasons for Linking Words
immigration
and Use synonyms
emigration
differentiate , the least Use synonyms
reason
for Use synonyms
immigration
is no Use synonyms
reason
stated and for Use synonyms
Use synonyms
emigration
the least Add a comma
,emigration
reason
is formal study.Use synonyms