
The charts compare the amount of water used for agriculture, industry and homes around the world, and the number of the resource consumed by Bralizans and Congoleses.
It is clear that
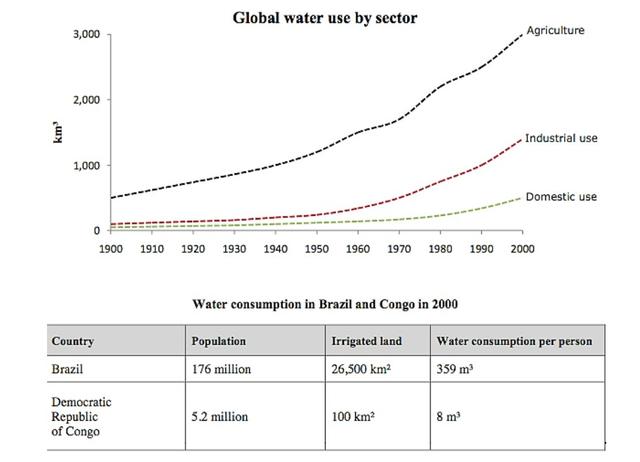
global water needs rose significantly between 1900 and 2000, and that farming accounted for the largest proportion. We can Linking Words
also
see that the resource was consumed higher in Brazil than in the Congo.
In 1900, around 500km³ of the resource was used on farmland worldwide. The figures for industrial and domestic consumption stood at around one-fifth of that amount. By 2000, agricultural use on the globe had increased to around 3000km³, industrial use had risen to just under half that amount, and the figure consumed by households had reached approximately 500km³.
In the year 2000, the populations of Brazil and the Congo were 176 million and 5.2 million respectively. Water consumption per person in the South American country, at 359m³, was much higher than that in the African country, at only 8m³, and Linking Words
this
could be explained by the fact that Brazilians had 265 times more irrigated land than Congoleses.Linking Words