
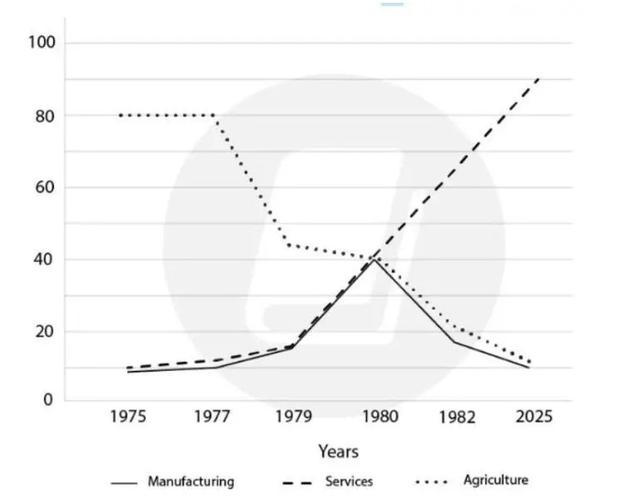
The graph informs about the trends of job occupation in the USA and predictions for 2025.
Overall
, it can be seen that the trends of agriculture will continue to drop down Linking Words
while
services employment gradually increases over the next 50 Linking Words
years
. The Manufacturing will fluctuate until 2025.
Use synonyms
Firstly
, the agriculture sector remained flat in 80 from 1975 to 1977. Suddenly, the next 5 Linking Words
years
witnessed a dramatical dropped. It will be predicted to continue a significant fall to 2025 and hit the lowest bottom.
Use synonyms
On the other hand
, Services employment witnessed a consistent rise over 4 Linking Words
years
from 1975. The forecast will continue to rocket up until 2025 and reach its peak at 90.
Aside from that, In 1980 the Manufacturing occupation saw a gradual increase and hit its highest peak in 1980. But in the future, it will drop sequentially over the next 45 Use synonyms
years
and hit the lowest number at around 10.Use synonyms