
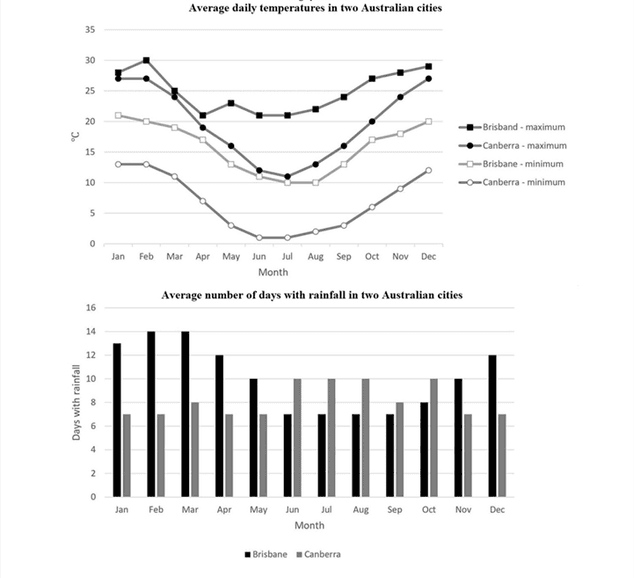
The chart illustrates the
temperature
difference in each day from January to December in two Australian cities and the bar chart shows the number of Use synonyms
days
of Use synonyms
rainfall
in each Use synonyms
month
. Use synonyms
According to
the data, the Linking Words
otemperature
has been reported in Correct your spelling
temperature
celsius
Capitalize word
Celsius
degrees
and the selected places were Use synonyms
Brisbane
and Use synonyms
Canberra
. It is Use synonyms
obvius
that Correct your spelling
obvious
Brisbane
was the warmest city throughout the year.
Use synonyms
According to
the chart,in January, Linking Words
Brisbane
and Use synonyms
Canberra
had nearly the same Use synonyms
temperature
Use synonyms
although
both of these cities had huge Linking Words
discrepancy
in Fix the agreement mistake
discrepancies
temperature
Use synonyms
in
each day. At Change preposition
apply
Brisbane
, the maximum Use synonyms
temperature
was just below 30 and the minimum was just above 20 in January Use synonyms
while
Linking Words
Canberra
had the highest value just below Brisbrand and the lowest value between 10-15. Use synonyms
However
, in Linking Words
thefollowing
Correct your spelling
the following
month
, Use synonyms
Brisbane
had their peak level of Use synonyms
temperature
Use synonyms
as
30 Change preposition
at
degrees
and 10 Use synonyms
degrees
difference was the lowest level. Use synonyms
Canberra
had the same line of maximum and lowest Use synonyms
temperature
Use synonyms
this
Linking Words
month
. Use synonyms
In addition
, Linking Words
Brisbane
had the lowest Use synonyms
temperature
in July and August and which was 10 whilst Use synonyms
Canberra
had just above 0 in June and July. In December, both cities were hot because they reached nearly 30 Use synonyms
degrees
as highest with huge fluctuations in each Use synonyms
month
.
Use synonyms
Secondly
, Linking Words
Brisbane
had the highest Use synonyms
rainfall
in February and March and there was a reduction of rain in June, July and August and it increased when reached in December up to 12 Use synonyms
days
. Use synonyms
Canberra
had 10 Use synonyms
days
per Use synonyms
month
as maximum numbers in June, July and August Use synonyms
while
other months had nearlyLinking Words
thesame
number of Correct your spelling
the same
days
of Use synonyms
rainfall
.
It is very clear that Use synonyms
Brisbane
had more Use synonyms
rainfall
than Use synonyms
Canberra
in the whole year Use synonyms
beacuse
each and every Correct your spelling
because
month
there were more Use synonyms
days
than Use synonyms
Canbera
.Correct your spelling
Canberra