
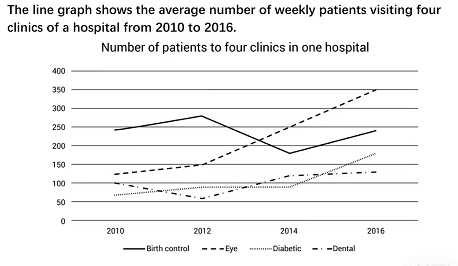
The line graph illustrates the number of people per week that visited different clinics of a hospital from the years 2010 to 2016.
Overall
, all data had fluctuations but the birth control Linking Words
clinic
had the most patients in the beginning. Use synonyms
However
, it was suppressed by the eye Linking Words
clinic
in the end.
Use synonyms
Firstly
, birth control health Linking Words
centre
started around 250 and increased to 270 infirm in the Fix the agreement mistake
centres
year
2012.
Use synonyms
Nevertheless
, it dropped vigorously to 170 one Linking Words
year
later. It ended with about 240 patients. In the same way, the diabetic Use synonyms
clinic
had visitors around 60 at the start of the period which is the lowest among the 4 clinics. It increased a little bit to nearly 100 and maintained for the next 2 years. Use synonyms
Conversely
, it inclined significantly to almost 170 in the Linking Words
year
2016.
Meanwhile, the dental polyclinic had an initial number of 100 patients which dropped to 50 and Use synonyms
then
increased to approximately 130 which managed to maintain to around 140 Linking Words
at the end
of the period Linking Words
Lastly
, the eye Linking Words
clinic
begin at around 120 and showed an upward trend till the Use synonyms
year
2016.
It climbed to 150 one Use synonyms
year
later. Use synonyms
In addition
, it continued to grow to 250 Linking Words
then
stop at 350 people a week Linking Words
finally
.Linking Words