
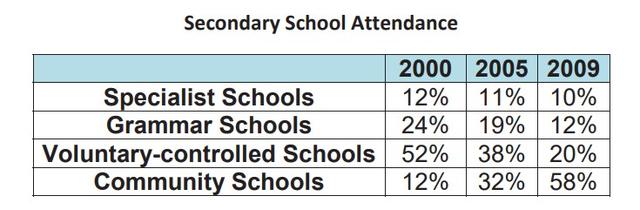
The provided table gives data about the percentage of visiting different academies from 2000 to 2009.
Overall
, at first glance, Linking Words
it is clear that
in community Linking Words
schools
Use synonyms
at the end
of the supplied period was the highest attendance, Linking Words
whereas
in specialist Linking Words
schools
it was the lowest.
Use synonyms
Initially
, during 2000 the most visits were in Voluntary-controlled Linking Words
schools
, just above that half, Use synonyms
while
in Specialist and community Linking Words
schools
it was absolutely the same at around one in ten. At the same time, Grammar Use synonyms
schools
ranked second with almost one-fourth.
Between 2005 and 2009 years, in Specialist School's proportions of pupils attending slightly decreased to tens becoming the fewest in visits, meanwhile in Community Use synonyms
schools
over the next 5 ,years it sharply increased to approximately a third and continued to go up in 2009 until just below that three in fifth, came at the top. Regarding the rest departments Use synonyms
such
as Grammar and Voluntary-controlled, there Linking Words
also
were a sharp decline to 12% and one in fifth, respectively.Linking Words