
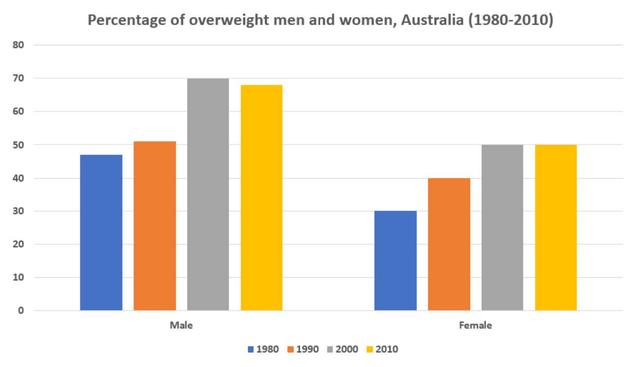
The given bar chart compares how many percentages of males and females were overweight in Australia between 1980 and 2010.
Overall
, the figure for overweight Linking Words
men
was higher than that for overweight women over the period shown. Another noticeable observation is that the overweight rate for both genders rose over the years until 2000 before the trend was bucked.
Looking at the graph in detail, the overweight rate for both genders increased drastically from 1980 to 2000. Use synonyms
According to
the data in 1980, 45% of males were overweight Linking Words
whereas
the rate of females was only around 29%. The figures for overweight Linking Words
men
and women kept increasing and reached a peak in 2000, at about 69% and 49% respectively in 2000.
Between 2000 and 2010, there was a different pattern. Over Use synonyms
this
period, Linking Words
while
the proportion of overweight Linking Words
men
slightly dropped to 68%, the figure for women remained unchanged, at about 49%, which was still much lower than that of Use synonyms
men
.Use synonyms