You should spend about 20 minutes on this task. The pie charts below show reasons why people left the UK for other countries and why people stayed in the UK. Summarise the information by selecting and reporting the main features, and make comparisons where relevant. Write at least 150 words.

You should spend about 20 minutes on this task.

The pie charts below show reasons why people left the UK for other countries and why people stayed  in the UK.

Summarise the information by selecting and reporting the main features, and make comparisons where relevant.

Write at least 150 words.
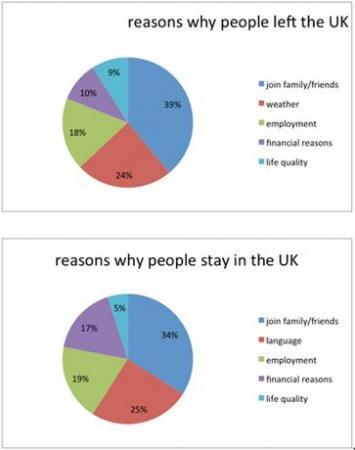
These two pie charts illustrate the five causes of
people
who stayed in the
UK
or left the
UK
for other countries. In sum, the majority of reason for
people
to leave or stay in the
UK
was the same.
However
, it is
also
noticeable that the second concern
for
Add a missing verb
was for
show examples
those who were different.
People
were more likely to stay in the
UK
since join families and friends,
this
was the same reason for those who left the
UK
, with a percentage of 39% and 34%, respectively.
However
, 24% of the proportion of
people
choose to leave the
UK
since the weather, which was the second priority compared with other reasons. 28% of the proportion of
people
considered work setting which ranked second for the reasons that
people
staying in the
UK
. Financial reasons and taxation were not really taken considered by
people
whether they staying or leaving in the
UK
, which value was below 11%.
Submitted by yqchen2023 on

Unauthorized use and/or duplication of this material without express and written permission from this site’s author and/or owner is strictly prohibited. Excerpts and links may be used, provided that full and clear credit is given to Writing9 with appropriate and specific direction to the original content.

Sentences: Add more complex sentences.
Linking words: Don't use the same linking words: "however".
Basic structure: Change the fourth paragraph.
Vocabulary: Replace the words people, uk with synonyms.
Vocabulary: Only 6 basic words for charts were used.
Vocabulary: The word "proportion" was used 2 times.
Vocabulary: The word "stayed" was used 3 times.
Vocabulary: Use several vocabularies to present the data in the fourth paragraph.
What to do next:
Look at other essays: