
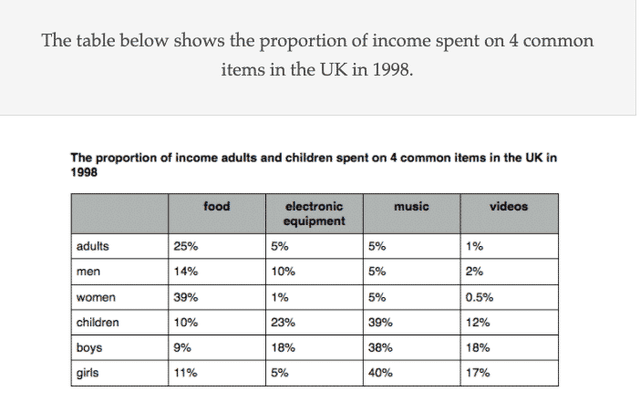
The supplied table illustrates the percentage of income which was spent on four items (
food
, electronic equipment, Use synonyms
music
, and videos) by Use synonyms
adults
and Use synonyms
children
in the UK in 1999.
Use synonyms
Overall
, it can be noted that Linking Words
adults
mostly spend on Use synonyms
food
, Use synonyms
while
Linking Words
children
spent the majority of their money on electronic equipment, Use synonyms
music
, and videos. Use synonyms
Furthermore
, it can be seen that Linking Words
men
and Use synonyms
women
spend mostly on Use synonyms
food
, but Use synonyms
boys
and Use synonyms
girls
spend the most on Use synonyms
music
.
In terms of Use synonyms
food
, a quarter of Use synonyms
adults
spend their salary on Use synonyms
this
category ( Linking Words
women
spend the most at 39% as opposed to Use synonyms
men
at 14%. Use synonyms
Children
, Use synonyms
on the other hand
, spend 10% of their pocket cash on Linking Words
this
item, and Linking Words
girls
spend slightly more than Use synonyms
boys
.
In the case of electronic equipment, Use synonyms
children
spend their money more than Use synonyms
adults
and 23% and 5% respectively. The difference between Use synonyms
men
and Use synonyms
women
was 9% Use synonyms
whereas
in the case of Linking Words
boys
and Use synonyms
girls
, it was 13%. Use synonyms
Likewise
, a similar trend can be seen when it comes to Linking Words
music
. Use synonyms
Children
spend the most at 39% which was seven times higher than Use synonyms
adults
. Both Use synonyms
girls
and Use synonyms
boys
spend around 40% compared to Use synonyms
men
and Use synonyms
women
at 5%. Use synonyms
Similarly
, where videos are concerned, Linking Words
children
spend more than Use synonyms
adults
by 11.Use synonyms