
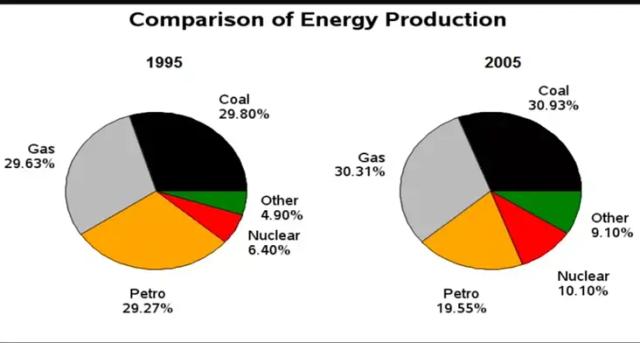
The charts provide information on how
energy
was produced in France by different resources in the years 1995 and 2005. Use synonyms
Overall
, coal contributed the most to Linking Words
energy
production in those two time periods.
Use synonyms
Firstly
, looking at coal, there is a slight increase in its usage over the years, from 29.80% to 30.93%. Linking Words
Similarly
, people in France used more gas in 2005, with an increase of 0.68%, from just under a third of Linking Words
energy
production to slightly over a third. Coal and gas, together, made up just over three-fifths of the Use synonyms
energy
generation in 2005.
Use synonyms
Furthermore
, looking at the remaining resources, Petro showed a declining trend, from 29.27% in 1995 to 19.55%. Linking Words
In contrast
, Nuclear illustrated a marginal demand in 2005, rising from 6.40% in 1995 to 10.10% in 2005. For the other types, they Linking Words
also
had a significant demand, increasing from 4.90% in 1995 to 9.10% in 2005.Linking Words