
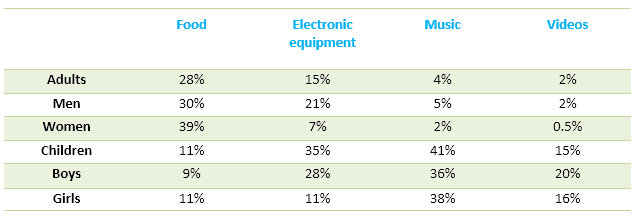
The given table highlights information about the portion of both adult genders
as well as
teenagers' salaries which were spent on four categories in the United Kingdom in 2005.
Linking Words
Overall
, it can be seen that Electronic equipment Linking Words
along with
Music items were popular among adolescents Linking Words
while
women mostly used up their wages for eating and daughters as well surprisingly paid highly for videos.
Looking at the details, the portion of food items was from 9% to 39% and it is shown that adults were eager to spend money on fast food and boys were unwilling Linking Words
conversely
. Linking Words
Besides
, the ratio of Electronic equipment was from 7% to 35%. It means females used up less cash than teenagers totally.
If we look at Music, it had the least portion among matures from 2 % to 5% Linking Words
although
it was the favourite among juveniles with a percentage from 36% to 41%. Interestingly, the same trend is obvious in videos by way of having percentages under 3% among adults Linking Words
along with
having ratios from 15% to 20% among adolescents.Linking Words