
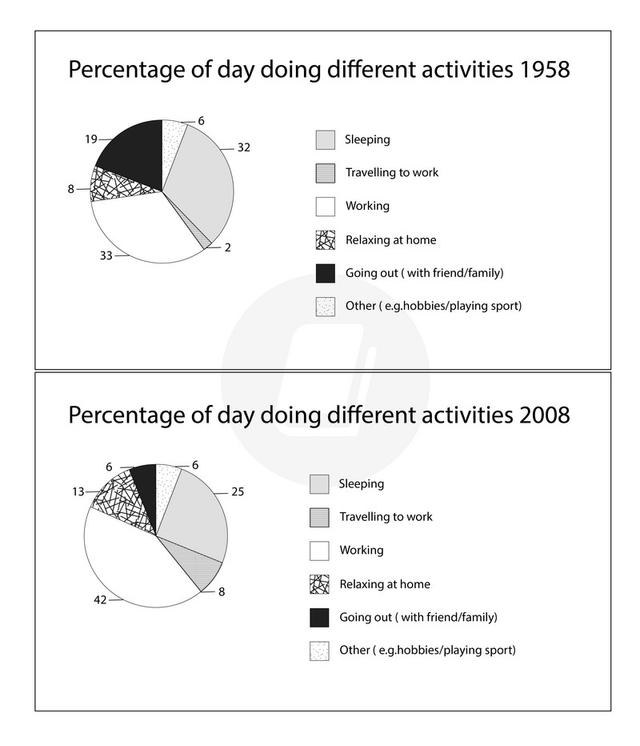
The pie graphs illustrated how much time employed adults had in percentages by doing some activities in a specific nation in 1958 and 2008.
Looking from an
overall
perspective, from 1958 to 2008 most of the habits presented higher time spent by comparing the percentages. It was shown that workers slept 7% more in 1958 ( 32%) than in 2008 (25%).
The other activities increased in Linking Words
this
50-year gap except for travel to work which appeared to be only 2% in 1958 and in 2008 8%, around 4 times more.
Linking Words
In addition
, relaxing at home had a surprisingly increased, 8% in 1958 and 13% in 2008.
Linking Words
To conclude
, 4 particular activities had more time spent by worker adults in comparison to only three that presented a diminished in the total of seven habits demonstrated at the pie chats.Linking Words