
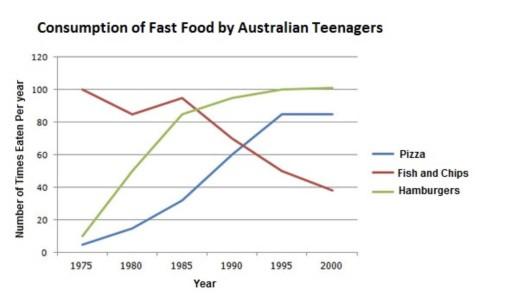
The chart illustrates the number of how many
times
Australian teenagers eat fast foods per year between 1975 and 2000. Use synonyms
Overall
, it can be seen that Pizza and Hamburgers experienced an increase, Linking Words
whereas
fish and chips decreased significantly.
Linking Words
To begin
with, the number of fish and chips consumed stood at 100 Linking Words
times
, which is much higher than the other foods at around 10 Use synonyms
times
. Use synonyms
However
, the Linking Words
consumption
of hamburgers increased drastically by almost 80 Use synonyms
times
in 1985. Afterwards, in 1995, it reached a peak of 100 Use synonyms
times
and remained stable until the end of the period. Meanwhile, the Use synonyms
consumption
of pizza witnessed a consistent rise, and reach a peak at just above 80 Use synonyms
times
in 1995 and forwards.
Use synonyms
On the other hand
, the Linking Words
consumption
of fish and chips dropped steadily by around 20 Use synonyms
times
. After rising gradually, it dropped dramatically from 90 Use synonyms
times
until just below 40 Use synonyms
at the end
of the period, which makes it the lowest number of Linking Words
consumption
.Use synonyms