
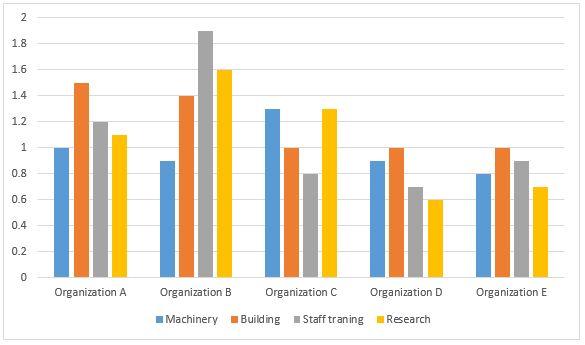
The given bar chart provides information about the financial investment by five organizations in different sectors (Machinery, Building, Staff training, Research), in 2015.
As an
overall
assessment, it can be clearly seen that, out of all the organizations, the highest amount of money is invested by Organization B in staff training, Linking Words
on the contrary
, Organization D is the weakest investor, investing a minimal amount of money in research.
Organization A has made its largest investment in the construction sector, and its contribution in the other three sectors is almost equal. Firm B has invested the highest amount of money in research and Staff training categories, Linking Words
whereas
management D has invested the least in the aforementioned categories. Linking Words
Furthermore
, the average investment of institutions A and B is relatively higher than the other three companies.
Organizations D and E remain the weakest investor in all three sectors.Linking Words