
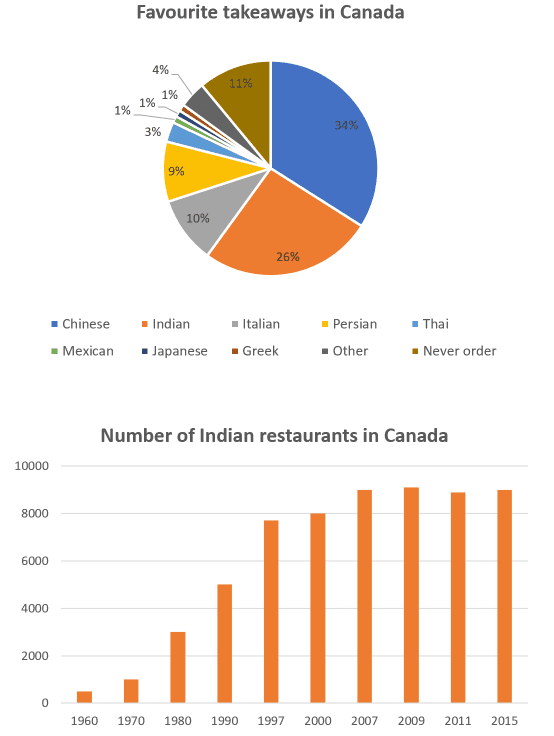
The pie chart illustrates the proportion of each country's enjoyment rate for takeaway by Canadian people, in a 55-year period (1960-2015).
Overall
, most Canadians ordered Chinese food, Linking Words
while
the lowest percentage was represented by food from Geek, Japanese and Mexic.
Linking Words
Firstly
, the most enjoyed takeaway was Asian nutriment, representing 34% and, in second place was Indian feed representing 26%. Linking Words
Nevertheless
, 10% of individuals ordered Italian cooking and 9% Persian. Linking Words
Also
, 11% of Canadians have never ordered any foodstuffs. Italian foodstuff represented less than a third of Chinese cooks.
Linking Words
Secondly
,only a small percentage of 3% ordered Thai food ,and 4% ordered another type of foodstuff that had not been shown in the options. Representing the lowest percentages, all 3 with the same number of 1% were takeaways from Geek, Japanese and Mexic. Linking Words
Moreover
,there was a huge difference between Chinese and Japanese percentages, from 34% to 1%, a change of 33%.Linking Words