
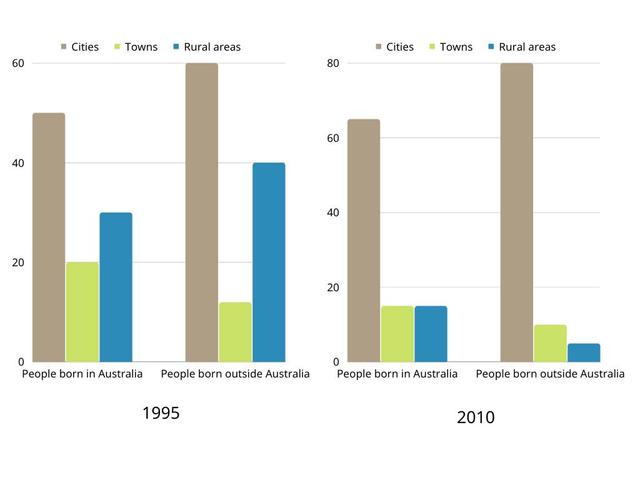
The bar chart elaborates on the proportions of Australian citizens and immigrants that make up Australia, divided by three
catergories
: Cities, Towns and Rural areas.
Generally speaking, it can be Correct your spelling
categories
infered
that the most populated Correct your spelling
inferred
location
, with both locals and foreigners, are Fix the agreement mistake
locations
metropolitans
areas.
Examining the charts, we can see that Australian cities are more popular amongst outsiders, both in 1995 and 2010. The same can Change the noun form
metropolitan
also
be said about the natives, who began to live more in Linking Words
cites
as time went on.
Looking at towns and rural areas, they Correct your spelling
cities
are
used to be more Unnecessary verb
apply
crowed
in 1995. Correct your spelling
crowded
However
, fast forward a few years, they are observed to significantly Linking Words
decreases
in percentage, especially amongst foreigners. By the time of 2010, the Wrong verb form
decrease
proportions
of people who Fix the agreement mistake
proportion
lives
Change the verb form
live
in
outside of Change preposition
apply
cites
Correct your spelling
cities
takes
up not even a fourth of the entire population.
In sum, we can Wrong verb form
took
deduced
from looking at the bar chart that people Change the verb form
deduce
has
only migrated into cities over time. It is estimated that, with Correct subject-verb agreement
have
mordenization
, the proportions will only get more unbalanced.Correct your spelling
modernization
modernisation