
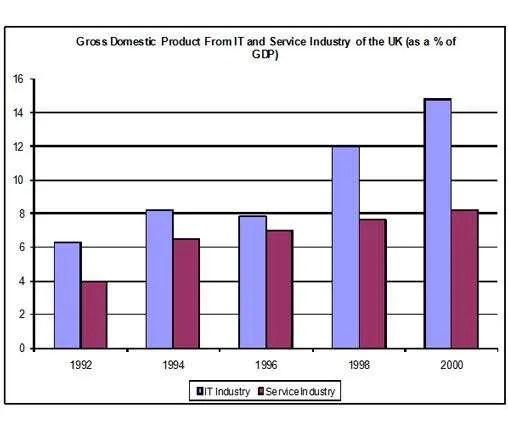
The above chart illustrates the different forms of gross domestic product (GDP) ( IT and
Service
Use synonyms
industry
) in the United Kingdom from 1992 to 2000. These values are calculated in Percentages.
In 1992, the IT Use synonyms
industry
was more than 6% which increased by 8 in 1994. In the 1992 Use synonyms
service
Use synonyms
industry
was 4 which jumped to 7 by 1994. In 1996, the IT Use synonyms
industry
was nearly 8 which increased by 12 in 1998. In 1996 it was around 7 which increased a little by 1998. In the 2000, the IT Use synonyms
industry
was highest with around 15. In the Use synonyms
Service
Use synonyms
industry
was more than 8. The great development took place from 1992 to 2000 in both Use synonyms
service
and IT.
Use synonyms
To conclude
, from 1992 to 2000 the IT Linking Words
industry
Use synonyms
as well as
the Linking Words
service
Use synonyms
industry
increased. The above information describes the given chart which shows the GDP stands for gross domestic product.Use synonyms