
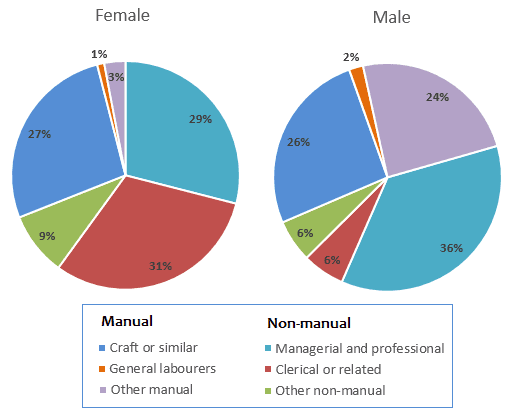
The display pie charts describe the employment pattern in Great Britain in 1992. The below information, male and female in manual and non-manual they are craft or similar, general labourers, other manual, managerial and professional, clerical or related and other non-manual. The data is in %.
Firstly
, In the year 1992, in the Females, the highest was clerical or related with 31%, Craft or similar was 29%, General labourers was 1%, Other manual was 3%, Managerial and professional was 27%, and other non-manual was 9%. Linking Words
Secondly
, In the year 1992, in the males, the highest was managerial and professional with 36%, craft or similar was 26%, general labourers were 2%, other manual was 24%, clerical or related Linking Words
as well as
other non-manual was 6%. Linking Words
Thirdly
, ThereLinking Words
a
great difference between Add a missing verb
is a
male
and Fix the agreement mistake
males
female
.
Fix the agreement mistake
females
To conclude
, the above information describes the male as well Linking Words
female
employment pattern. The data on employment Correct word choice
as female
pattern
in great Fix the agreement mistake
patterns
britain
in 1992.Change the capitalization
Britain