The table below shows the estimated literacy rates by region and gender for 2000-2004. Summarise the information by selecting and reporting the main features, and make comparisons where relevant.

The table below shows the estimated literacy rates by region and gender for 2000-2004.

Summarise the information by selecting and reporting the main features, and make comparisons where relevant.
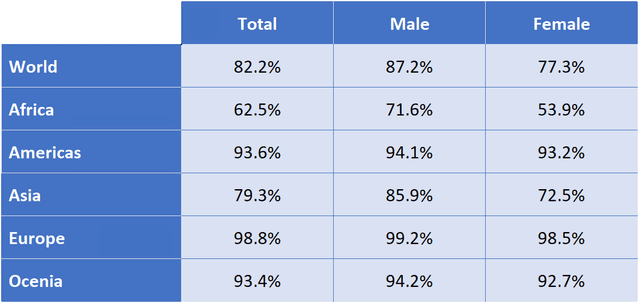
the bar chart illustrates the proportion of the estimated literacy by region and gender for 4 years, starting in 2000
overall
the percentage of total in Europe was the highest with 93.6%
while
in Africa was the lowest with only 62.5%
to begin
there was 87.2% male and 77.3% female literacy worldwide,
while
the rate in America was 94.1% and 93.2%. Africa accounted for 71.6% of males and 53.9% of females studied,
while
Asia made up a significantly higher fraction of 85.9% of males and 72.5% of females. And
finally
, the percentage of Oceania were 94.2% male and 92.7% female, which was very close to Europe when it had 99.2% males and 98.5% female estimated literacy
Submitted by trung642k6 on

Unauthorized use and/or duplication of this material without express and written permission from this site’s author and/or owner is strictly prohibited. Excerpts and links may be used, provided that full and clear credit is given to Writing9 with appropriate and specific direction to the original content.

Sentences: Add more complex sentences.
Linking words: Don't use the same linking words: "while".
Conclusion: The conclusion is too long.
Common mistake: Your writing should be 150-250 words.
Vocabulary: Only 5 basic words for charts were used.
Vocabulary: The word "percentage" was used 2 times.
What to do next:
Look at other essays: