
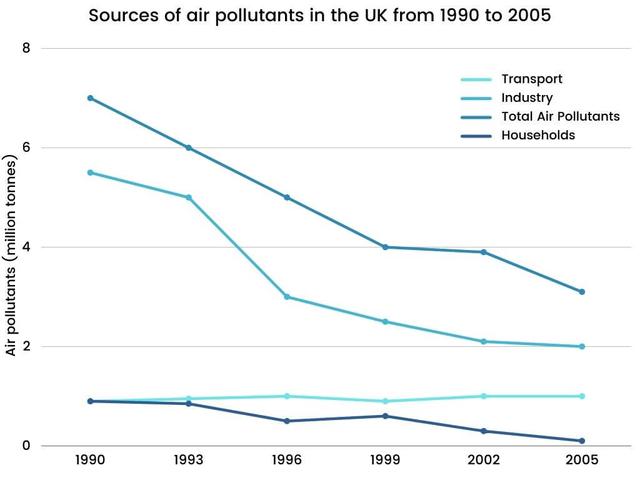
The presented line chart illustrates the main factors of air pollution in the UK from 1990 to 2005.
Overall
, a declining trend can be seen in all the sources through these 15 years. Linking Words
Moreover
, industries were predominant during Linking Words
this
time span Linking Words
however
their air pollutants decreased considerably more than the other ones.
The figure for Industry began at 5.5 Linking Words
million
tonnes in 1990, followed by a 0.5 Use synonyms
million
decrease in 1993. For the next 3 years, they experienced a significant drop to less than 3 Use synonyms
million
and they finished the period in 2 Use synonyms
million
. The same pattern applied to the total amount of pollutants which started at 7 Use synonyms
million
tonnes and declined to 3 Use synonyms
million
.
Use synonyms
Although
transport and households amounted to 1 Linking Words
million
at the beginning of the survey period, they did not finish at the same point and transport had a trifling climb to 1.2 Use synonyms
million
tonnes in 2005 Use synonyms
while
the pollution produced by households dropped steadily in the Linking Words
last
3 years to less than 0.3 Linking Words
million
.Use synonyms