The bar chart shows the percentage of Australian men and women in different age groups who did regular physical activity in 2010.

The bar chart shows the percentage of Australian men and women in different age groups who did regular physical activity in 2010.
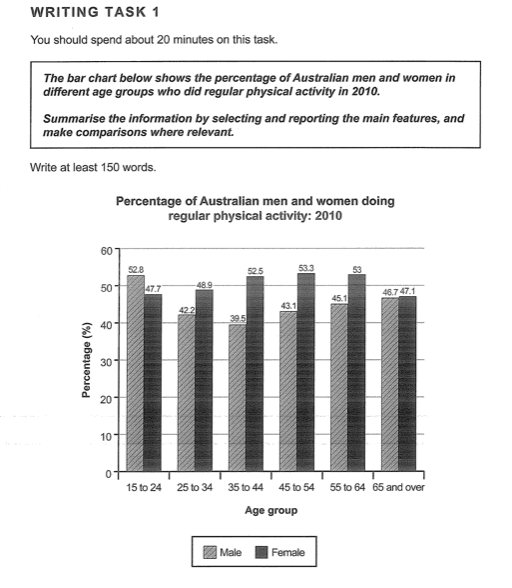
The bar chart illustrates that In 2010, the
percentage
of males and females on 6 different
age
scales did regular physical exercises. In terms of gender, the
percentage
of women between the ages of 15 to 24, 25 to 34, 35 to 44 and 45 to 54 increases steadily (47.7 % , 48.9% , 52.5% and 53.3 % respectively ) and starts to decrease after the
age
of 54.
On the other hand
, in men, there is a regular decrease in
percentage
between the ages of 15 to 24, 25 to 34, and 35 to 44, (52.8 % , 42.2% , 39.5% respectively)
then
it starts to increase and continues regularly.
Overall
, the number of women who did regular physical activity was higher than men. The only time scale in which males’
percentage
was higher than females’ is 15 to 25 ages. (52,8% and 47,7% respectively) The highest
percentage
belongs to females whose
age
is between 45 to 54 ( 53.3%) and the lowest
percentage
belongs to males whose
age
is between 35 to 44 ( 39.5%).
Submitted by asik.melliss on

Unauthorized use and/or duplication of this material without express and written permission from this site’s author and/or owner is strictly prohibited. Excerpts and links may be used, provided that full and clear credit is given to Writing9 with appropriate and specific direction to the original content.

Sentences: Add more complex sentences.
Vocabulary: Replace the words percentage, age with synonyms.
Vocabulary: Rephrase the word "percentage" in your introduction.
Vocabulary: Only 6 basic words for charts were used.
Vocabulary: The word "percentage" was used 6 times.
Vocabulary: The word "decrease" was used 2 times.
Vocabulary: The word "increases" was used 2 times.
Topic Vocabulary:
  • Physical activity
  • Regular exercise
  • Age demographics
  • Participation rate
  • Trend analysis
  • Gender disparity
  • Health initiatives
  • Public health policies
  • Statistical comparison
  • Lifestyle choices
  • Work commitments
  • Age-related factors
  • Preventative health
  • Exercise habits
  • Surveillance data
  • Motivators and barriers
What to do next:
Look at other essays: