
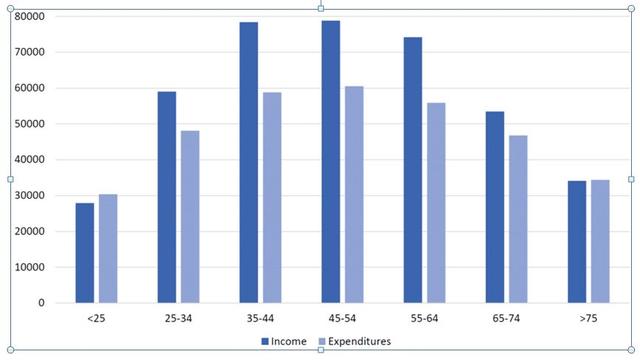
The bar graph illustrates the amount of outlay and outcome of US citizens by different age groups in 2013.
Overall
, Linking Words
middle age
groups had the biggest proportion of Add a hyphen
middle-age
earning
and spending, Fix the agreement mistake
earnings
moreover
income Linking Words
valeus
Correct your spelling
values
generally
higher than expenditures for all age categories.
The group of below-25-year-old citizens had just below 30000 Add a missing verb
were generally
dollars
value income which was slightly lower than their outcome. Use synonyms
However
, the elderly who were older than 75 years old had roughly equal revenues and expenditures which was around 35000 Linking Words
dollars
.
The remaining populations had quite similar patterns 35-Use synonyms
44 year-old
and 45-Add a hyphen
44-year-old
54 year-old
people had the biggest income with below 80-thousand Add a hyphen
54-year-old
dollars
, Use synonyms
on the other hand
, Linking Words
second
group of people's spending Change the article
the second
slightly
higher which was more than Add a missing verb
was slightly
60-thousand
Correct your spelling
60 thousand
dollars
.Use synonyms