
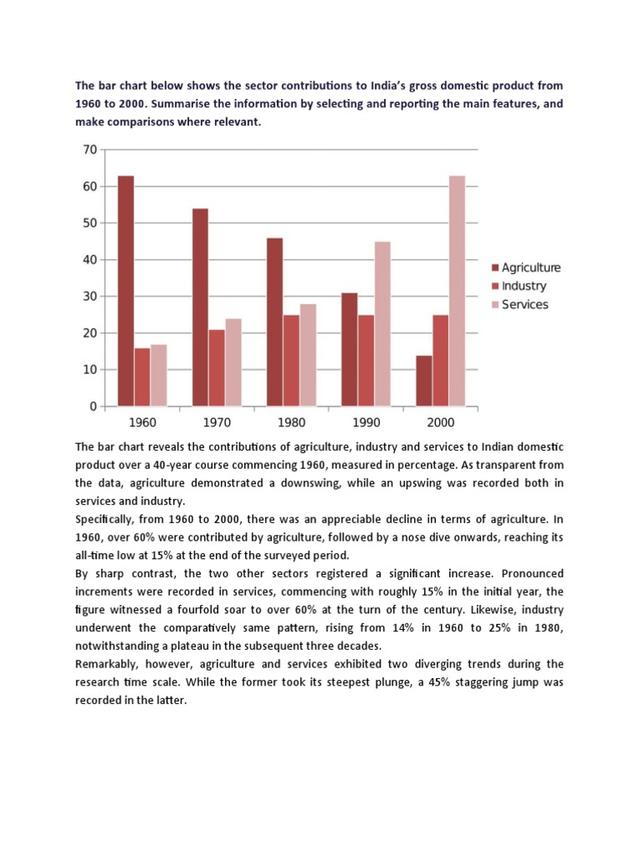
The bar graph illustrates the percentage of contributions made by agriculture, industry, and services sectors to the Indian financial system between 1960 and 2000.
It is clear that
the importance of agriculture has decreased steadily Linking Words
while
services had a dramatic growth decade by decade. Meanwhile, the industry experienced a slow increase but Linking Words
then
it commenced to go down from 1980 onwards.
In 1960, agriculture contributed by far the highest of India's GDP, peaking at 62 %, but Linking Words
then
it reduced continuously to a low of 13% by the year 2000. Linking Words
In contrast
, the services sector played a minor role in domestic products. Linking Words
This
Station gradually changed and Linking Words
this
sector's contribution boomed from 23% to 62% between 1970 to 2000.
Linking Words
Therefore
, industry remained a steady contributor to India's economy through the 40-year period. Better 1960 and 1980 it saw a 10% increase Linking Words
then
remained static from 1980 to 2000, preserving consistent a share of Linking Words
Overall
GDP.Linking Words