The chart below shows the percentage of people who ate five portions of fruits and vegetables per day in the UK from 2001 to 2008. Summarize the information by selecting and reporting the main features and make comparisons where relevant. Write at least 150 words.

The chart below shows the percentage of people who ate five portions of fruits and vegetables per day in the UK from 2001 to 2008. Summarize the information by selecting and reporting the main features and make comparisons where relevant.

Write at least 150 words.
The chart below illustrates the amount of British people and their consumption of fruits and vegetables per day. Let’s have a look at the table closer.
Overall
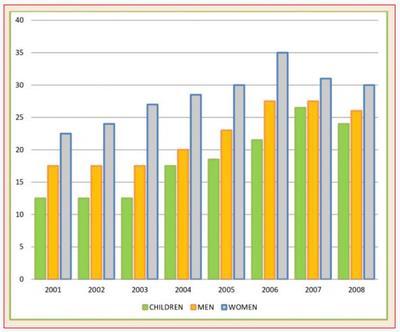
, there was a steady increase in the number of the nation who ate five portions of fresh products from 2001 to 2006,
while
in 2007 it started to decrease. In 2001, the percentage of children who consume fruits and vegetables was at the lowest score (13 per cent).
However
, in 2007 it reached a peak of almost 25 per cent respectively and
then
, in 2008 showed a downward trend. The number of women consuming rose since 2001 and in 2006 gained the highest mark,
whereas
men's intake remained stable for almost 3 years and in 2004 sharply surged. In the following five years,
this
quantity fluctuated. It is obvious, that in 2008 all the numbers went down, especially women's rates compared to 2006.
Submitted by aida.ai2000 on

Unauthorized use and/or duplication of this material without express and written permission from this site’s author and/or owner is strictly prohibited. Excerpts and links may be used, provided that full and clear credit is given to Writing9 with appropriate and specific direction to the original content.

Sentences: Add more complex sentences.
Vocabulary: The word "number of" was used 2 times.
Vocabulary: The word "almost" was used 2 times.
What to do next:
Look at other essays: