
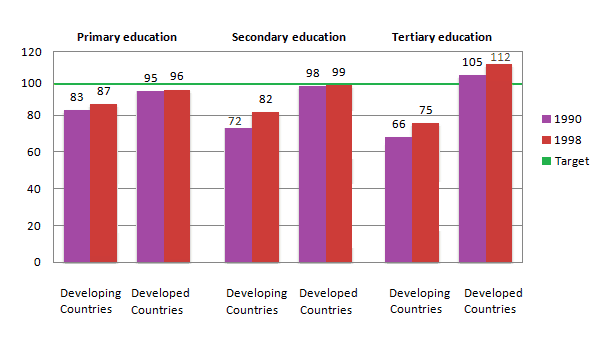
The bar chart depicts the figure of females per 100 males studied in primary, secondary and tertiary schools from developing and developed societies over the 1990 and 1998 periods.
Overall
, it can be clearly seen that the target for each academy was equal, but only students from developed communities in secondary faculty almost achieved the goal, Linking Words
whereas
young women from developing lands in tertiary education fractionally less per hundred guys. Linking Words
However
, young ladies from developed states, who studied in post-secondary faculty, were slightly more than boys
Observing the details, what about teenagers in 1990 in developing countries, it did not reach the aim in every level of education with the majority of 83 females in initial school. But, if we look at the 1998 year, it had the better situation with 87, 82 and 75 students in all three schools, respectively.
Linking Words
By contrast
, there was an almost achieved goal for developed countries in 1990 with 98 girls per 100 boys in middle school and the number of girls exceeded the number of schoolboys, 105 per 100, respectively. Linking Words
Following
Linking Words
this
, in 1998, there was a nearly equal amount of males and females with the exception of tertiary school with 112 girls per a hundred boys.Linking Words