
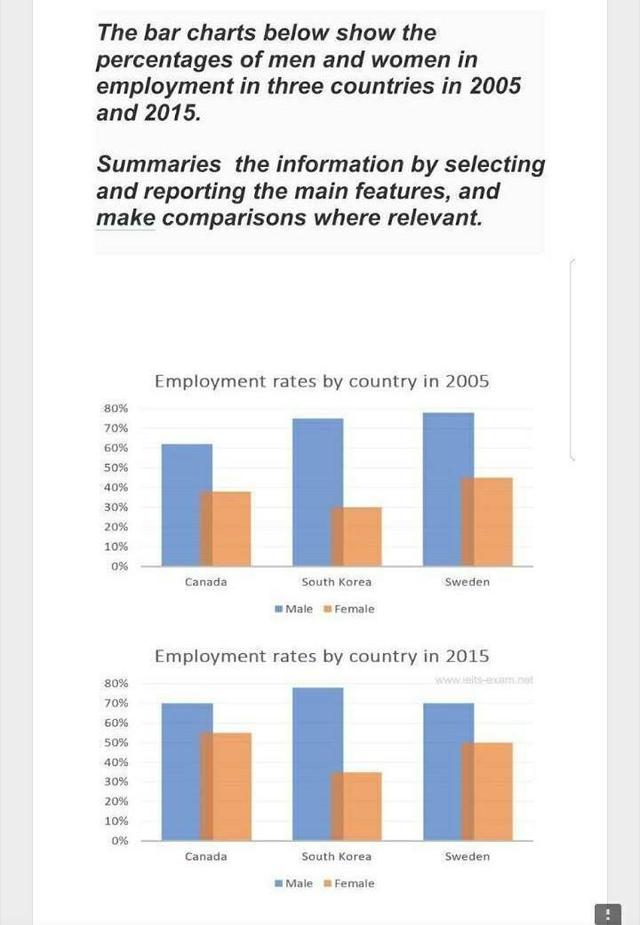
The given schemes illustrate the rate of males and females who were recruited in three different countries, namely,
Canada
, South Use synonyms
Korea
and Use synonyms
Sweden
in two years, 2005 and 2015.
Use synonyms
Overall
, obviously, gentlemen were employed more than ladies in all given countries, Linking Words
however
, in South Linking Words
Korea
a tiny Use synonyms
percent
of women had a job in comparison to Replace the word
percentage
Sweden
and Use synonyms
Canada
.
In 2005, in Use synonyms
Use synonyms
Sweden
the majority of men were recruited and their Add a comma
,Sweden
number
accounted for an overwhelming 80%, which was almost twice as many as the Use synonyms
number
of women who worked in the same country. Use synonyms
On the contrary
, the Linking Words
number
of employed males among the Canadians constituted 60%, which was almost 15% less than the Use synonyms
number
of males who had a job in South Use synonyms
Korea
.
In 2015, there were similar patterns concerning the rate of employees among gentlemen in Use synonyms
Canada
and Use synonyms
Sweden
, which made up a hefty 70% each. Meanwhile, in Use synonyms
Use synonyms
Sweden
every second woman was recruited, Add a comma
,Sweden
although
, in South Linking Words
Use synonyms
Korea
the Add a comma
,Korea
number
of employed ladies accounted for just over 30 Use synonyms
percent
, which was almost one-half of the Change the spelling
per cent
number
of females that worked in Use synonyms
Canada
.Use synonyms