
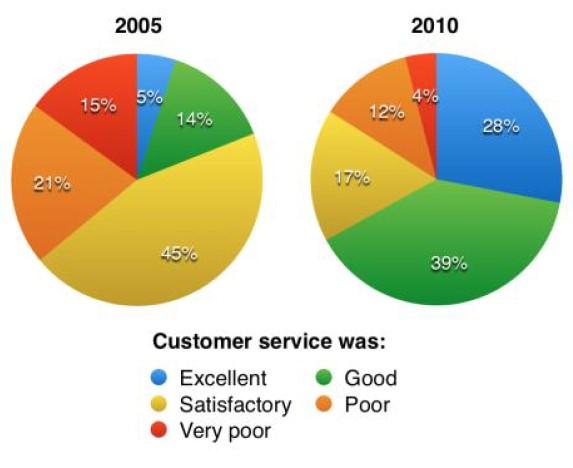
The pie graph illustrates the number of consumer services. they inquire, whether they are rated or not in Parkway Hotel. I will give you a comparison between
2005 to 2010.
Overall
, it's clear that in 2005 most people were satisfied, with nearly half of the others service. Linking Words
However
, in 2010 it appears that the good assessment is about fourthLinking Words
,
if we compare it with other servers.
First of all, in 2005 customer service was less than in 2010, which looked at 26% were not happy, and the green colour was just a 14% ratio.
Remove the comma
apply
On the other hand
, in 2010, Linking Words
while
the figure of nations was good, there was an increase largely to 39%, which had been higher, but the number of people who were satisfactory declined to 17%. Linking Words
Although
, customer review that was not satisfactory, their results decreased to 16%, and Linking Words
then
, the result of the excellent review was raised to 28% for a total score among other evaluation.Linking Words