
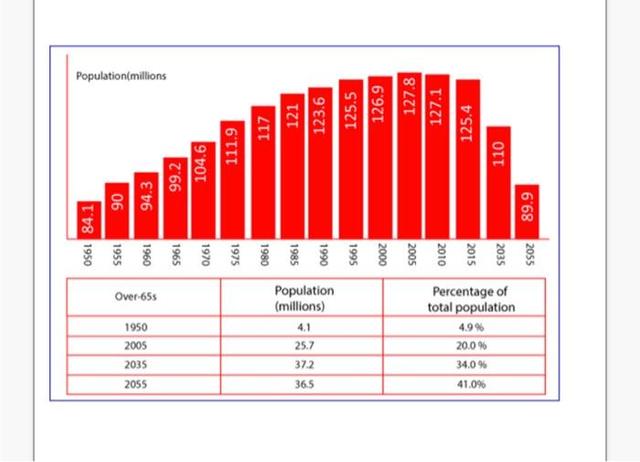
The bar graph illustrates the
population
and Use synonyms
percentage
of elderly individuals over 65 in past, recent, and prospective Use synonyms
years
in Japan.
Use synonyms
Overall
, both the Linking Words
population
and the Use synonyms
percentage
of individuals with 65 or higher Use synonyms
years
old are increasing by each generation.
It can be seen from the pie chart that the highest expected Use synonyms
population
of citizens over 65 Use synonyms
years
old is in the year 2035, having 37.2 million. As opposed to that, the lowest account for citizens aged over 65 is in 1950 with 4.1 million citizens. There is an inconsistent increase in the Use synonyms
population
of elderly people with the age of 65 as from 1950 to 2035, there is an increase in Use synonyms
population
. Use synonyms
However
, from 2035, the Linking Words
population
decrease from 37.2 to 36.5 in 2055.
Use synonyms
On the contrary
, there is a consistent increase in the Linking Words
percentage
of the total Use synonyms
population
of elderly groups over the age of 65. The initial Use synonyms
percentage
was 4.9 in 1950 and consistently increased by approximately 15% to 2035 and rose 7% in the later Use synonyms
years
from 2035 to 2055.Use synonyms