
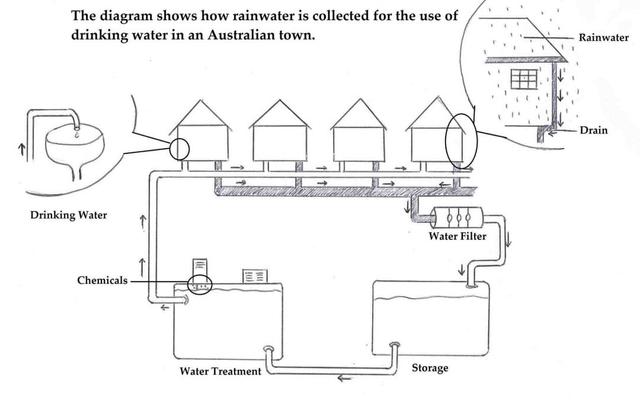
The diagram presents the process of producing drinking
water
from gathering rainwater in a town in Australia. Use synonyms
Overall
, Linking Words
water
is processed through three main steps from the filter to the chemical treatment to serve consumers.
Use synonyms
Firstly
, when it rains, each house collects rainwater from its roof and goes through gutters, eventually running into drains at the bottom of the house. Linking Words
Then
the installed one large pipe underneath of houses gathers Linking Words
water
from four houses and sends Use synonyms
water
through a filter to remove physical, biological and chemical contaminations from various causes Use synonyms
as a result
of making purified Linking Words
water
.
Use synonyms
Secondly
, after the process of Linking Words
water
filtration from households, filtered Use synonyms
water
is kept in a large industrial size of storage tank to move on to the next final step. The Use synonyms
last
procedure is Linking Words
water
treatment which is so-called sanitization to produce safe drinkable Use synonyms
water
for the public. In fact, the Use synonyms
water
storage tank and the treatment tank are connected with one duct and a couple of factories are built it on, eventually, Use synonyms
water
is treated by releasing chemicals from an upper building and carried away to houses in a town. Use synonyms
Finally
, rainwater is used without any adverse events.Linking Words