
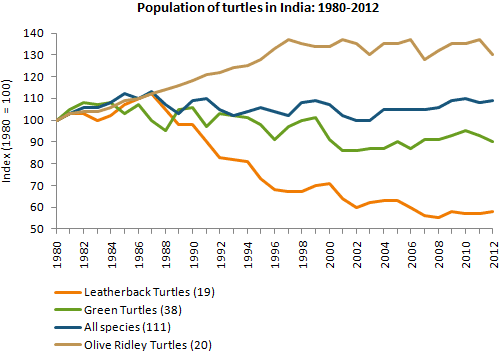
The line graph illustrates the number of different
species
of Use synonyms
turtles
living in India from the Use synonyms
year
1980 to 2012.
Use synonyms
Overall
the population of the different Linking Words
species
of Use synonyms
turtles
were the same, but over the years Use synonyms
this
trend changed. The Leatherback Linking Words
Turtles
showed the highest reduction from the first Use synonyms
year
to the Use synonyms
last
one, whilst the proportion of the Olive Ridley Linking Words
Turtles
presented the highest increase.
The figures for the Leatherback Use synonyms
Turtles
decreased Use synonyms
betwee
1988 to 2012, after having an Correct your spelling
between
inconscistent
increase Correct your spelling
inconsistent
in
1980 to 1987, the number of its Change preposition
from
populations
went from 100 to 60 in 2012. Fix the agreement mistake
population
On the other hand
, despite some fluctuations, the Linking Words
species
of Olive Ridley Use synonyms
turtles
had Use synonyms
increase
from 100 to over 130 in the Change the verb form
increased
year
2012.
For Green Use synonyms
Turtles
, the trend was less consistent, having some fluctuations during the period but ending with a similar figure as when it started, from 100 in the first Use synonyms
year
to a Use synonyms
liitle
bit more than 100 in the Correct your spelling
little
last
Linking Words
year
. Between the period, the numbers for All Use synonyms
Species
followed a similar pattern, presenting some fluctuations but not growing a lot, starting with 100 and ending with almost the same number.Use synonyms