
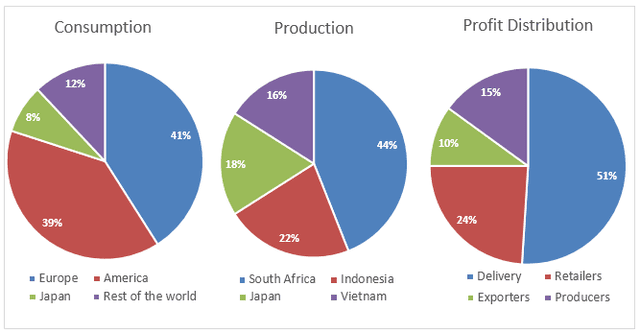
The pie charts make a comparison between the respective percentages of
coffee
consumption and production based on the regions all around the world, Use synonyms
as well as
the profit gained by each party involved. Europe consumes Linking Words
coffee
more than the other continents, Use synonyms
whereas
the country Linking Words
that is
the highest contributor to making caffeine is South Africa. Linking Words
Furthermore
, the majority of income generated by the Linking Words
coffee
industry was given to the delivery company.
Europe leads the Use synonyms
coffee
consumption proportion among all regions in the globe. More than 40% of global consumption was made by Europe, which is slightly higher than America. Use synonyms
In addition
, almost half of the global Linking Words
coffee
production came from South Africa, contributing as much as around 44%.
More than half of the profit distribution of the Use synonyms
coffee
industry is gained by the delivery party. On the other side, caffeine exporters only got around 10% of the margin generated from Use synonyms
coffee
sales.Use synonyms