The charts below show the percentages of male and female students getting top grades in 1960 and 2000. Summarise the information by selecting and reporting the main features and make comparisons where relevant.

The charts below show the percentages of male and female students getting top

grades in 1960 and 2000. Summarise the information by selecting and reporting the

main features and make comparisons where relevant.
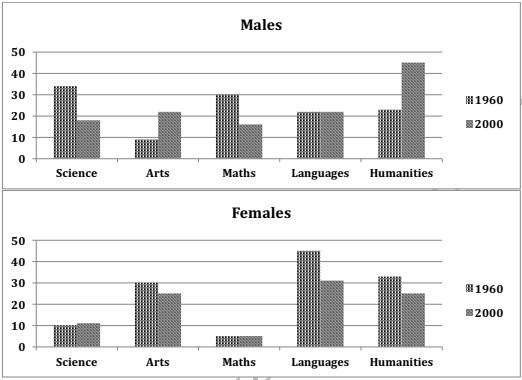
The bar charts illustrate the rates of girls and
boy
Fix the agreement mistake
boys
show examples
students acquiring
highest
Correct article usage
the highest
show examples
marks in different subjects in the
years
1960 and 2000 respectively. It can be clearly observed that females got
greatest
Correct article usage
the greatest
show examples
grades for languages in
both
years
whereas
males scored the highest for
the
Correct article usage
apply
show examples
science in 1960 and the humanities in 2000.
Moreover
, Maths was the least favourite subject among ladies. Taking female students into
acoount
Correct your spelling
account
, in
both
years
Mathematics scores were the lowest but it was the second biggest scorer in 1960 for boys.
Similarly
, in 2000 it held the third most
significancy
Correct your spelling
significance
amongst males.
Subsequently
, there was a huge gap in Arts and Humanities results in
both
gender groups for
both
years
.
However
, female outcomes were at altitude compared to
males
Change the noun form
male
show examples
marks for Languages.
In contrast
, gentlemen had the best achievements in Science in 1960, but
this
has shifted to Humanities in 2000.
Submitted by prarthana1r on

Unauthorized use and/or duplication of this material without express and written permission from this site’s author and/or owner is strictly prohibited. Excerpts and links may be used, provided that full and clear credit is given to Writing9 with appropriate and specific direction to the original content.

Sentences: Add more complex sentences.
Common mistake: Your writing should be 150-250 words.
Basic structure: Change the second paragraph.
Basic structure: Change the fourth paragraph.
Vocabulary: Replace the words years, both with synonyms.
Vocabulary: Only 3 basic words for charts were used.
Vocabulary: Use several vocabularies to present the data in the second paragraph.
Vocabulary: Use several vocabularies to present the data in the fourth paragraph.
Topic Vocabulary:
  • percentages
  • top grades
  • achievement
  • gender disparity
  • educational trends
  • academic performance
  • comparison
  • decade
  • educational policy
  • societal expectations
  • improvement
  • educational attainment
  • graduates
  • academic excellence
  • statistics
  • educational landscape
  • benchmark
  • parity
  • gender roles
  • historical data
  • performance indicators
  • educational improvements
  • longitudinal study
  • scholastic achievement
  • gender gap
What to do next:
Look at other essays: