
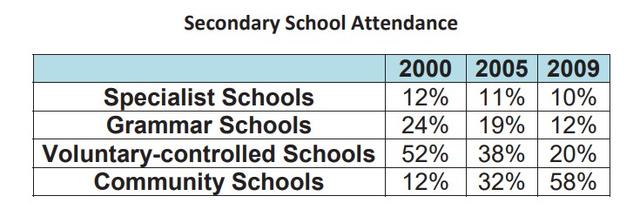
The percentage-based data in the table shows how many
students
attended each type of secondary school in the years 2000, 2005, and 2009.
Use synonyms
Overall
, The majority of attendees at first are free to attend. Controlled Linking Words
schools
and Use synonyms
community
and specialized Use synonyms
schools
have the lowest attendance rates. Use synonyms
While
the majority of Linking Words
students
in the final time frame attended Use synonyms
community
Use synonyms
schools
. Few Use synonyms
students
, though, attended specialized Use synonyms
schools
.
To start with, 12% of Use synonyms
students
were enrolled in Use synonyms
community
Use synonyms
schools
in 2000. Use synonyms
Additionally
, the same proportion of Linking Words
students
went to Use synonyms
specialty
Change the spelling
speciality
schools
. The greatest attendance in 2000 was at 24% for grammar Use synonyms
schools
and above 50% for voluntary managed Use synonyms
schools
. Use synonyms
Additionally
, 11% and 19% of Linking Words
students
, respectively, attended specialized Use synonyms
schools
and grammar Use synonyms
schools
.
The percentages of Use synonyms
community
and voluntary managed Use synonyms
schools
were highest in 2005, at 32% and 38%, respectively.
Use synonyms
Additionally
, just 10% of Linking Words
students
attended specialised Use synonyms
schools
in 2009, which was 2% fewer than grammar Use synonyms
schools
. In 2010, Use synonyms
community
Use synonyms
schools
had an all-time high student attendance of 58%, Use synonyms
while
voluntary-controlled Linking Words
schools
showed a sharp declining trend and finished up with only 20%.Use synonyms