
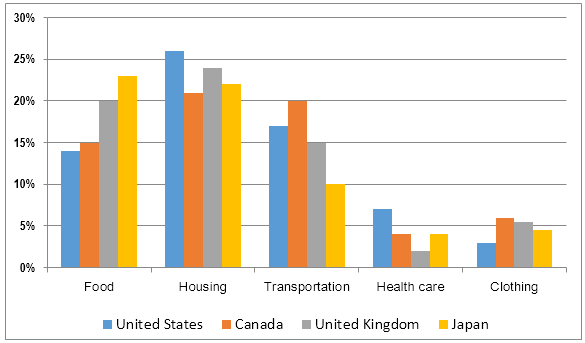
The bar chart depicts the shares of expenditure for five categories in 5 countries in 2009.
Overall
, all the countries underwent distinguished changes. Linking Words
While
food, housing and transportation accounted for the majority of the expenditures, the opposite could be seen in the other categories.
More than 50% of the budget was allocated for food, housing and transportation. Standing at 26%, US expenditure on housing was the highest, followed by the UK, Japan, and Canada. Linking Words
While
the Americans spent the most on housing, the Japanese’s food and housing expenses were equal, at 24%. Linking Words
Similarly
, Canadians had to pay 20% for both transportationLinking Words
,
and housing which was higher than the others.
Remove the comma
apply
On the other hand
, healthcare and clothing covered a minority of just under 10%. Linking Words
Whereas
the US was the only country which allocated more than 5% for medical, triple that figure for the UK, the others were below Linking Words
this
rate. Linking Words
Whereas
the US and Japan shared the same budgets of 4% on clothing, both Canada and the UK spent more than 6% which was 2% higher.Linking Words