
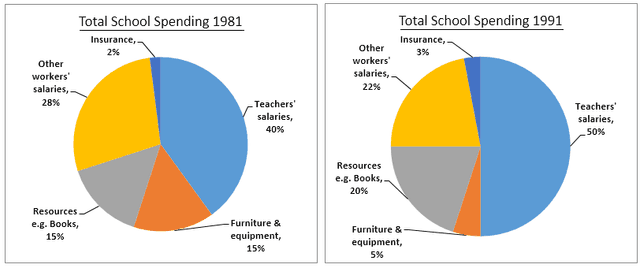
The proffered three pie charts provide information about the changes in expenditures per year by a particular school in the United Kingdom throughout three decades (1981, 1991, and 2001).
At first glance, it is readily noticeable that teachers’ salaries became the biggest proportion.
Whereas
, insurance spending contributed the lowest percentage in all periods.
Linking Words
According to
charts, the dominant position went to teachers’ salaries, making up 40%, 45%, and a half per cent respectively in all years. Linking Words
In contrast
, insurance spending reported the least expenditure. Linking Words
In addition
, It was followed by other workers’ salaries at 28% and 22% respectively as the second position in 1981 and 1991 Linking Words
while
a tiny fraction came from furniture and equipment spending in 2001. In terms of resources spending Linking Words
such
as books accounted for 15% and almost a tenth per cent in 1981, they were smaller than expenditure in 1991 which contributed one fifth per cent.Linking Words