
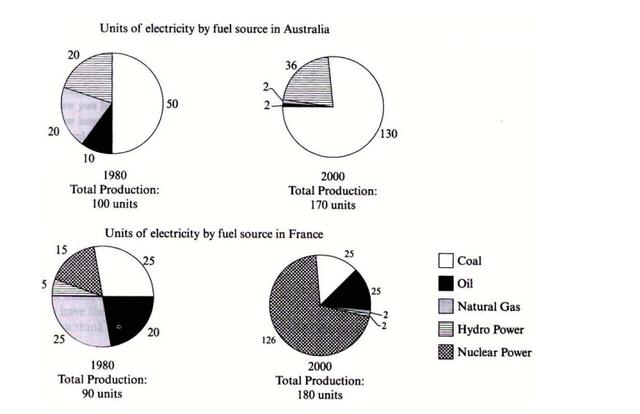
The diagrams depict information about electricity creation by energy sources in Australia and France in 1980 and 2000.
Overall
, the total production in both countries enhanced; Linking Words
moreover
, methods Linking Words
such
as coal and nuclear power replaced others.
Linking Words
To begin
with, in 1980 the Australian production was 100 Linking Words
units
, and 50% was made by coal, 20% by natural gas, and the same for hydropower. Use synonyms
On the other hand
, the French electricity was made up of different sources, and the total creation was less than the Australian one by 10 Linking Words
units
. Popular generations were from coal and natural gas, both had 25 digits. Nuclear power was not developed and was composed of 15 Use synonyms
units
.
Use synonyms
However
, the total generation in Australia made up 170 Linking Words
units
, the coal constituted 130 Use synonyms
units
, taking a significant part of the pie in 2000. Use synonyms
Conversely
, France's developed nuclear power consisted of 126 Linking Words
units
from a total of 180 Use synonyms
units
; Use synonyms
additionally
, other sources Linking Words
such
as coal and oil did not compose a large part of the statistics and consisted of 25 elements each.Linking Words