
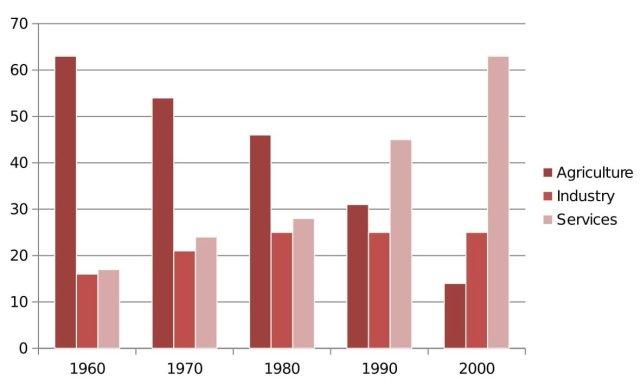
The bar chart illustrates
agriculture
, Use synonyms
industry
, and Use synonyms
service
contribution percentages in India's Use synonyms
GDP
from 1960 to 2000. Use synonyms
Overall
, the share of Linking Words
service
and Use synonyms
industry
sectors in Use synonyms
GDP
climbed with different intensities Use synonyms
whereas
Linking Words
GDP
made by the Use synonyms
agriculture
part witnessed a significant decline throughout the period.
In 1960, the Use synonyms
agriculture
portion of India's Use synonyms
GDP
accounted for approximately 60%, roughly five times more than Use synonyms
industry
and Use synonyms
service
at around 15%. Since Use synonyms
then
, the figure for Linking Words
agriculture
assistance fell steadily to a bottom of nearly 15% in the Use synonyms
last
year, which was less than the two other elements.
Linking Words
In contrast
, the stake in Linking Words
industry
experienced a gradual growth to about 25% in 1980 before remaining at the same level over the next three decades. Use synonyms
Likewise
, there was an upward trend in the Linking Words
service
rate from 15% in the initial year to just above 60% in the final year, considerably more than other segments.Use synonyms