
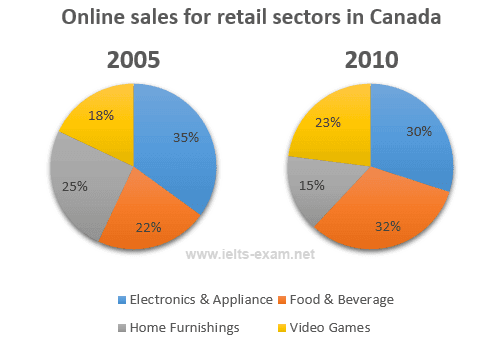
The pie graphs provide information about how online shopping revenue by retail sectors in Canada changed between 2005 and 2010.
Overall
, there was a considerable decline in the proportions of turnover of electronics, appliances and home furnishings; meanwhile, those for food, beverage and video games witnessed a significant increase. Linking Words
In addition
, electronics and appliances accounted for the biggest part at the beginning of the period, but it was surpassed by food and beverage in the final year.
In 2005, Canadian people spent 35% of their online shopping expenditure on electric devices, followed by a moderate tumble to 30% in 2010. A resembling shift can be seen in the figure for home furnishings, which started at 25% in 2005 before ending the given duration at 15%.
Linking Words
By contrast
, food and beverage contributed 22% to e-shopping proceeds, after which it saw almost double Linking Words
at the end
of the interval examined. Linking Words
Similarly
, the percentage of internet purchase income in Canada from video games was 18% in 2005, Linking Words
then
it significantly climbed to 23% in 2010.Linking Words