
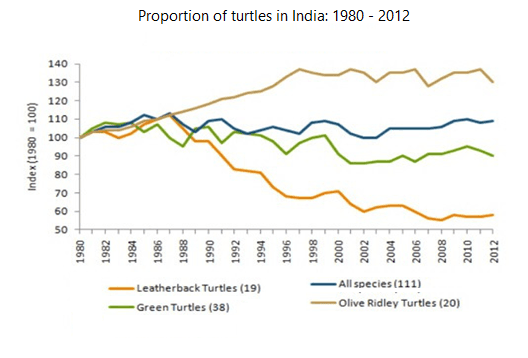
The graph, which depicts great detail, provides information about the total number of specific typologies of turtles that resided in India between the years 1980 and 2012.
Overall
, the Olive Ridley Turtles experience the most significant acceleration in terms of numeric wrought, meanwhile, the leatherback turtles constitute a downtrend in the course of 33 years in the selected figure.
Undoubtedly, the increase of the Olive Ridley sea creatures is very prolific. Indeed, the numbers show an uprising from a quantity of 100 in the 80s to a total of 130 in the first decade of the 20th century. Contrarily, results seem to be disappointing when focusing on the Leatherback species. During the established period of time, the picture registers a huge decrease in the population. Linking Words
Furthermore
, the numbers reduce to half its first result.
Linking Words
To sum up
, there is a big difference between the data collected from two of the selected categories of animals. On the one hand, Olive Ridley keeps on adding numbers with the passing of time, Linking Words
on the other hand
, leatherback’s allotments represent the opposite phenomenon.Linking Words