
The chart and
table
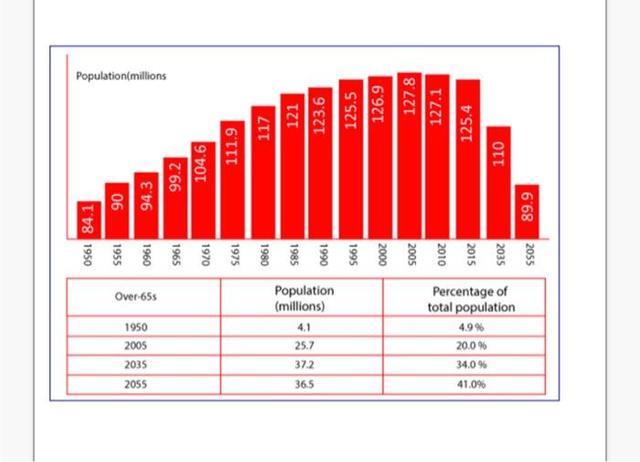
illustrate the Use synonyms
number of
population in Japan by two features millions and percentages from 1950 TO 2055.
Correct quantifier usage
apply
Overall
, it can be clearly seen that the population made an upgrade over the year 1950 until 2005 Linking Words
then
began to dwindle. Linking Words
whereas
the Linking Words
table
shows an increase in the years by 16 per cent.
Glacing at the chart and Use synonyms
table
reveals that, the population started to rise from the year 1950 by 84.1 million Use synonyms
while
in the Linking Words
table
only 4.1 million Use synonyms
in addition
the figures begin to rise hard because the fertility rates go up to achieve a high number of humans at 127.8 million in comparison with the Linking Words
table
it was 25.7 M with a 20.0 cent . Use synonyms
Moreover
, the ages fluctuated in the years 2035 and 2055, between 37.3 and 36.5 with a per cent of 34.0 and 41.0. Linking Words
Therefore
, the number was low in the chart exactly in the year 2035.Linking Words
However
, the amount of habitats dropped drastically in 2055 at 89.9 m.Linking Words