
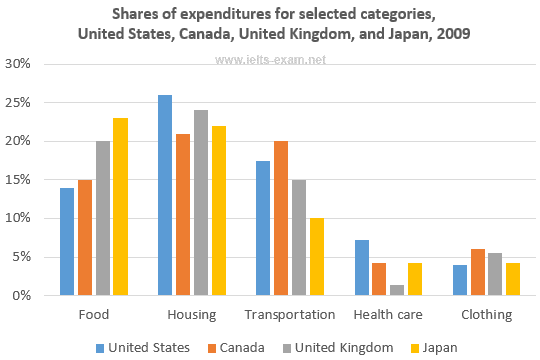
The bar chart illustrates the percentages of money allocated for 5 primary categories in 4 different countries.
Overall
, it is readily apparent that spending on food, housing, and transportation took up the majority. Linking Words
By contrast
, the figures for health responsibility and clothing made up the minority.
On the one hand, the United States appeared to be the leading community with the sum for housing at 26% which was 4% more than Canada. Meanwhile, the highest budget allocated for vehicles belonged to Canada. Linking Words
Moreover
, the medical expenses in the US were the highest which doubled in Canada by approximately 3%. Linking Words
However
, Canada’s spending on wardrobe was 3% more than the US.
Linking Words
On the other hand
, housing, food, and delivery were the majority of the expenditure in British and Japanese, at 50% and 55%, respectively. Linking Words
Additionally
, there was a similar statistic of the spending on foodstuff and accommodation in Japan at 22% Linking Words
while
travelling expenses were just half. Strikingly, the cost of fitness concern in the UK was the lowest, just one-third compared to clothing Linking Words
whereas
the total in Japan was the same.Linking Words