
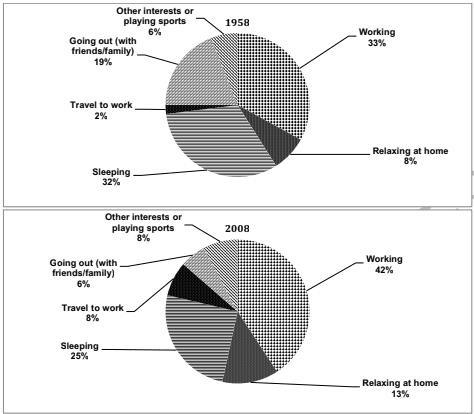
A glance at
pie
charts provided reveals a sharp comparison of the ratio of Correct article usage
the pie
time
working that adolescents used to distinction activities in a particular nation, measured in Use synonyms
percent
, between 1958 and 2008. Change the spelling
per cent
Overall
, people spent Linking Words
one -third
Correct your spelling
one-third of
Use synonyms
time
, in both 1958 and 2008, Correct article usage
the time
to
Change the verb form
working
work
and Use synonyms
sleep
.
In 1958, overwhelming proportions of the percentage of Wrong verb form
sleeping
time
working belonged to working and sleeping Use synonyms
with
33% and 32%, closely followed by going out( with friends or family) with 19%. Change preposition
at
Meanwhile
the third Add a comma
Meanwhile,
ranks
Fix the agreement mistake
rank
were
accounted for by three activities, Correct subject-verb agreement
was
such
as relaxing at home, other interests and travel to Linking Words
work
, with under 10%.
After half a century, Use synonyms
although
the ratio of Linking Words
time
working of both working and sleeping still remained the first rank, they had obvious alterations. Use synonyms
While
the percentage of a day, that people consumed to Linking Words
work
, exponentially increased to 42%, that of sleeping experienced a deterioration to 25%. Use synonyms
At the end
of the scale, the least significant proportions made up to other interests or playing sports, travel to Linking Words
work
and going out with 8%, 8% and 6% respectively. Meanwhile, the percentage of a day that adults used to relax at home accelerated to 13%.Use synonyms