
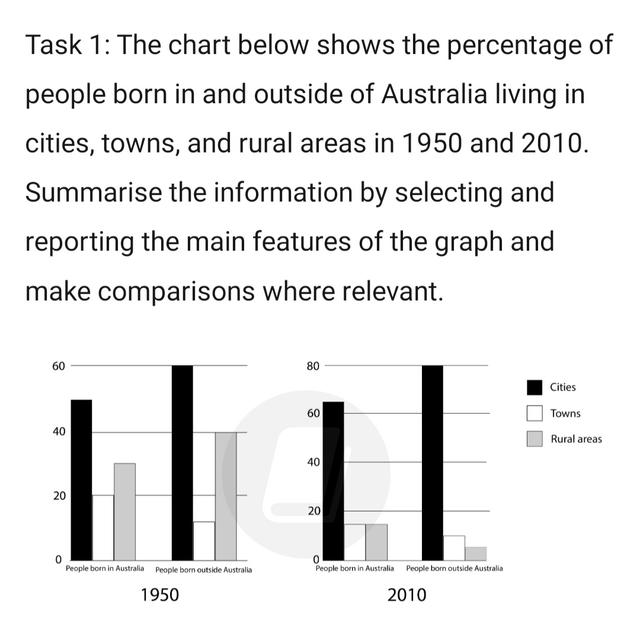
The Bar Chart illustrates the trend of how
people
who were born outside and inside Use synonyms
Australia
Use synonyms
living
in urban, rural, and town between 1995 and 2010.
Basically, Most of the Wrong verb form
lived
people
who were born in Use synonyms
Australia
in the mid-nineties prefer to live in Use synonyms
cities
rather than Use synonyms
towns
and rural Use synonyms
areas
. The same trend is observed for the Use synonyms
people
who were born outside Use synonyms
Australia
. About 60 Use synonyms
Use synonyms
percent
of non-Australians tend to live in Change the spelling
per cent
cities
and more than 40 Use synonyms
Use synonyms
percent
of Australians Change the spelling
per cent
Use synonyms
lives
in Correct subject-verb agreement
live
cities
. In both cases, Use synonyms
people
prefer to live in Use synonyms
cities
.
Use synonyms
However
, Linking Words
people
living in Use synonyms
towns
and rural Use synonyms
areas
are comparable less than Use synonyms
people
living in Use synonyms
cities
. 20 Use synonyms
Use synonyms
percent
of Australians Change the spelling
per cent
Use synonyms
lives
in Correct subject-verb agreement
live
towns
and more than 20 Use synonyms
Use synonyms
percent
of the Australian Population Change the spelling
per cent
lives
in Rural Use synonyms
Areas
. Non-Australians Use synonyms
shows
a different trend where 40 Correct subject-verb agreement
show
Use synonyms
percent
of the population Change the spelling
per cent
lives
in rural Use synonyms
areas
and less than 20 Use synonyms
Use synonyms
percent
Change the spelling
per cent
lives
in rural Use synonyms
areas
.
In 2010, 60 Use synonyms
Use synonyms
percent
of Australian Change the spelling
per cent
People
were born in Use synonyms
Cities
Use synonyms
,
and less than 20 Remove the comma
apply
Use synonyms
percent
of the population Change the spelling
per cent
born
either in Add a missing verb
was born
towns
or rural Use synonyms
areas
. But, Non-Australians were born mostly in Use synonyms
cities
rather than Use synonyms
towns
and rural Use synonyms
areas
Use synonyms
whereas
a whooping 80 Linking Words
Use synonyms
percent
were born outside Change the spelling
per cent
Australia
living in Use synonyms
cities
.Use synonyms