
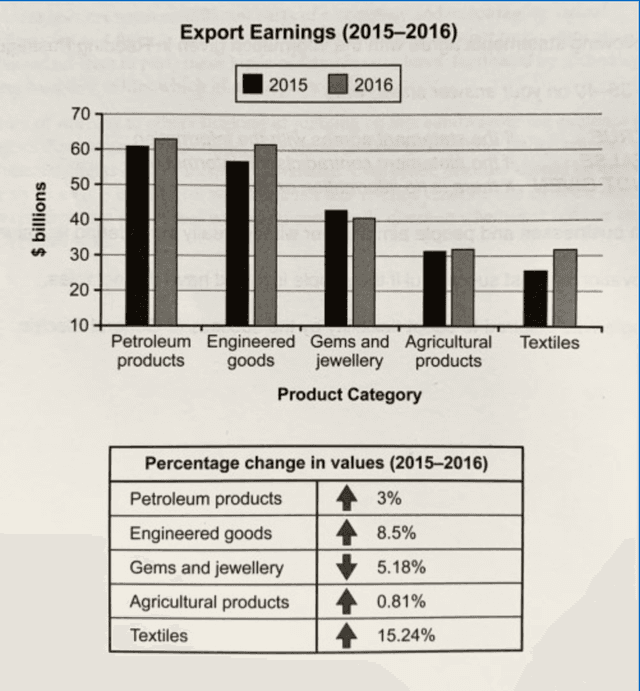
The provided bar graph reflects the amount of money that was earned from exporting several
products
in one country in two different years 2015 and 2016 Use synonyms
while
the table chart demonstrates the proportion change in the related Linking Words
value
of each category. Use synonyms
According to
the given Linking Words
charts
there were five types of Add a comma
charts,
products
: petroleum Use synonyms
products
, engineered Use synonyms
products
, Use synonyms
germs
and Use synonyms
jewellery
, agricultural Use synonyms
products
, and textiles.
Use synonyms
Overall
, after a thorough analysis of the given graphs, it can be plainly viewed that whilst petroleum Linking Words
products
were in the first place as the most commonly exported Use synonyms
products
, textiles came Use synonyms
last
. Linking Words
Additionally
, there was a gradual increase in the Linking Words
value
of each product except for Use synonyms
germs
and Use synonyms
jewellery
in 2015 and 2016.
In the beginning, regarding the bar chart, Use synonyms
whereas
petroleum Linking Words
products
were at the top as the most exported product in 2015 and 2016 and scored around 62 and 65 Use synonyms
billion
Use synonyms
dollars
, respectively, engendered items were in the second position which recorded about 56 and 62 Use synonyms
billion
Use synonyms
dollars
in 2015 and 2016, respectively. Use synonyms
In addition
to that Linking Words
germs
and Use synonyms
jewellery
registered approximately 43 Use synonyms
billion
Use synonyms
dollars
in 2015 and about 41 Use synonyms
billion
Use synonyms
dollars
in 2016, followed by agriculture Use synonyms
products
which hit slightly more than 30 Use synonyms
billion
Use synonyms
dollars
in both years.
Use synonyms
Furthermore
, moving to the table graph, the data suggests that the Linking Words
value
of textiles experienced a dramatic increase ( 15.24 per cent ), followed by engineered items that witnessed a significant upsurge in Use synonyms
the
Correct article usage
apply
value
as well (8.5%). Use synonyms
Moreover
, It is worth noticing that Linking Words
germs
and Use synonyms
jewellery
Use synonyms
products
were the only Use synonyms
products
that went through a sharp reduction to 5.18% in 2015 and 2016.Use synonyms