
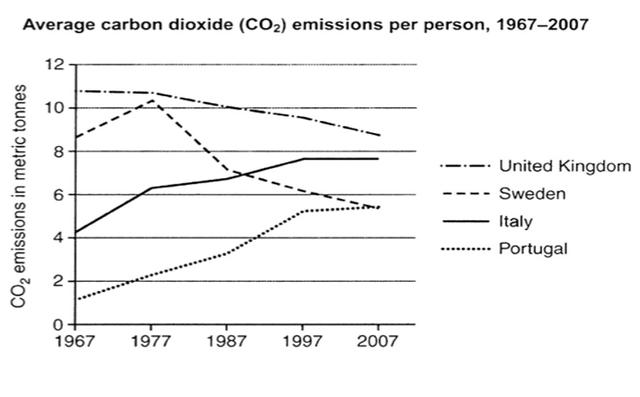
The line graph illustrates the middle carbonic acid gas (CO2) issue per
a
head of the population of Britain, Correct article usage
apply
Sweden
, Italy and Portugal in the years from 1967 to 2007.
Use synonyms
Overall
, it can be seen that the UK was the leading country regarding the CO2 emissions issued per person during Linking Words
this
40-year period, Linking Words
although
, there was a decrease in Linking Words
this
emission through the years, similar to the score in Linking Words
Sweden
. Use synonyms
In contrast
, there was a rise in data in Italy and Portugal.
In 1967 the major amount of carbon dioxide per person was discharged from the United Kingdom with around 11 metric Linking Words
tons
, but, Use synonyms
however
, Linking Words
this
quantity declined to about 9 in 2007. At the beginning of the period, Linking Words
Sweden
's emission was just over 8 metric Use synonyms
tons
, and in general, it decreased to 5.5 in 2007 with a brief climb to over 10 metric Use synonyms
tons
in 1977.
In Portugal and Italy, the releasement in 1967 was 1.5 and just over 4 metric Use synonyms
tons
, respectively. These numbers increased sharply until 2007 when they were almost 8 metric tonnes in Italy and 5.5 in Portugal, as the latter had the same issue as Use synonyms
Sweden
for the year.Use synonyms