
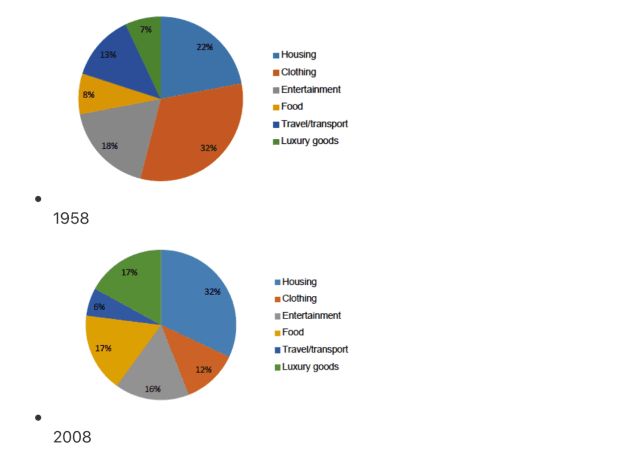
The pie chart represents the percentage of people’s spending on housing, clothing, entertainment, food, travel/ transport, luxury goods in a particular European country in 1958 and in 2008
As the graph shows, the figure for housing, food, luxury goods,
travel
/ transport grew significantly during the period. Correct word choice
and travel
While
the number of clothing was the highest in 1985. After 50 years, the value of housing was higher than the data for clothing.
In Linking Words
term
of the record Fix the agreement mistake
terms
of
Change preposition
apply
the
housing increased substantially from 22% to 32%. There was a slight growth in the figure for food from 8% to 19%. The tally of travel/ transport went up Correct article usage
apply
slighty
by 7%. The proportion of luxury goods witnessed a considerable rise from around 7% to 17%.
Correct your spelling
slightly
However
, there was a rapid decrease in people’s spending on clothing from 32% to 12% during the period. The declined slowly from 18% to 16%Linking Words