
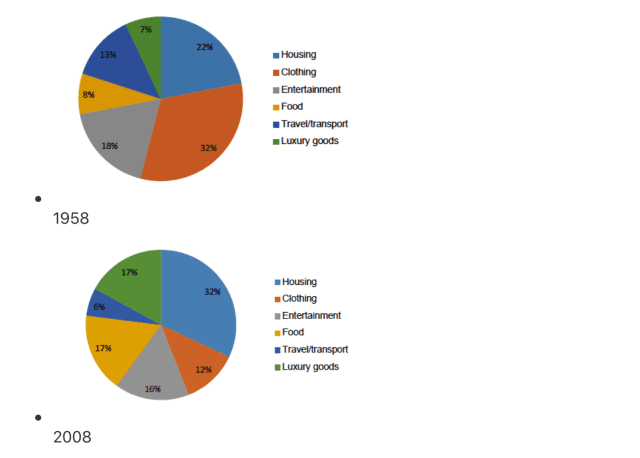
The bar charts below illustrate the percentage of six different kinds of personal expenditures in one specific European country in 2 years 1958 and 2008.
According to
the data, the expenses of housing, travel and luxurious goods saw a considerable rise during the period Linking Words
while
the other three factors namely food, clothing and entertainment observed the opposite pattern when the figures decreased slightly.
Linking Words
It is clear that
people spent most of their income on accommodations when the rate increased moderately from 22% to 32%, followed by the growth of the transport budget with nearly 10% higher in 2008 compared with 1958. Linking Words
In addition
, we can see that there was a rapid rise of 10% in the expense of luxury products. Generally, it was Linking Words
equal
10% increment for all three segments
Correct article usage
an equal
On the other hand
, there was a remarkable plummet of almost 20% in people's spending on food in 2008. Linking Words
In contrast
, the clothing and entertainment sectors witnessed a minimal decline of approximately 2% and 7% respectively.Linking Words